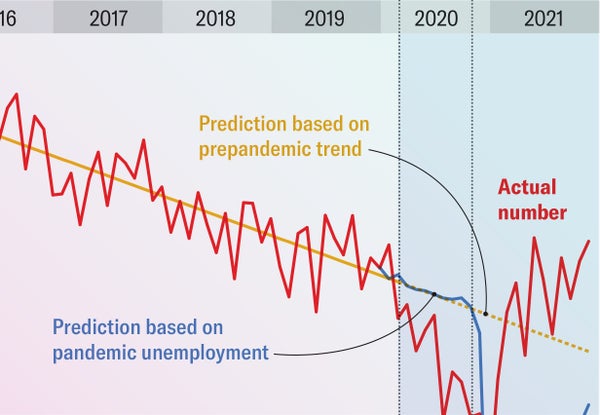
Birth rates tend to decline during economic recessions or disasters, so many experts predicted that the COVID pandemic would prompt people to have fewer children. A recent study of fertility trends in the U.S. from 2015 through 2021, however, reveals there was actually a baby bump.
Demographers expected to see a decline in birth rate in December 2020, nine months after COVID became a pandemic. But the decline started earlier than that. It was driven largely by a drop in births to people born outside the U.S.—especially people from China, Mexico and Latin America—who would have traveled here but were prevented by pandemic restrictions. Some of them would have been coming as immigrants, whereas others would have been visiting to secure U.S. citizenship for their babies before returning home.
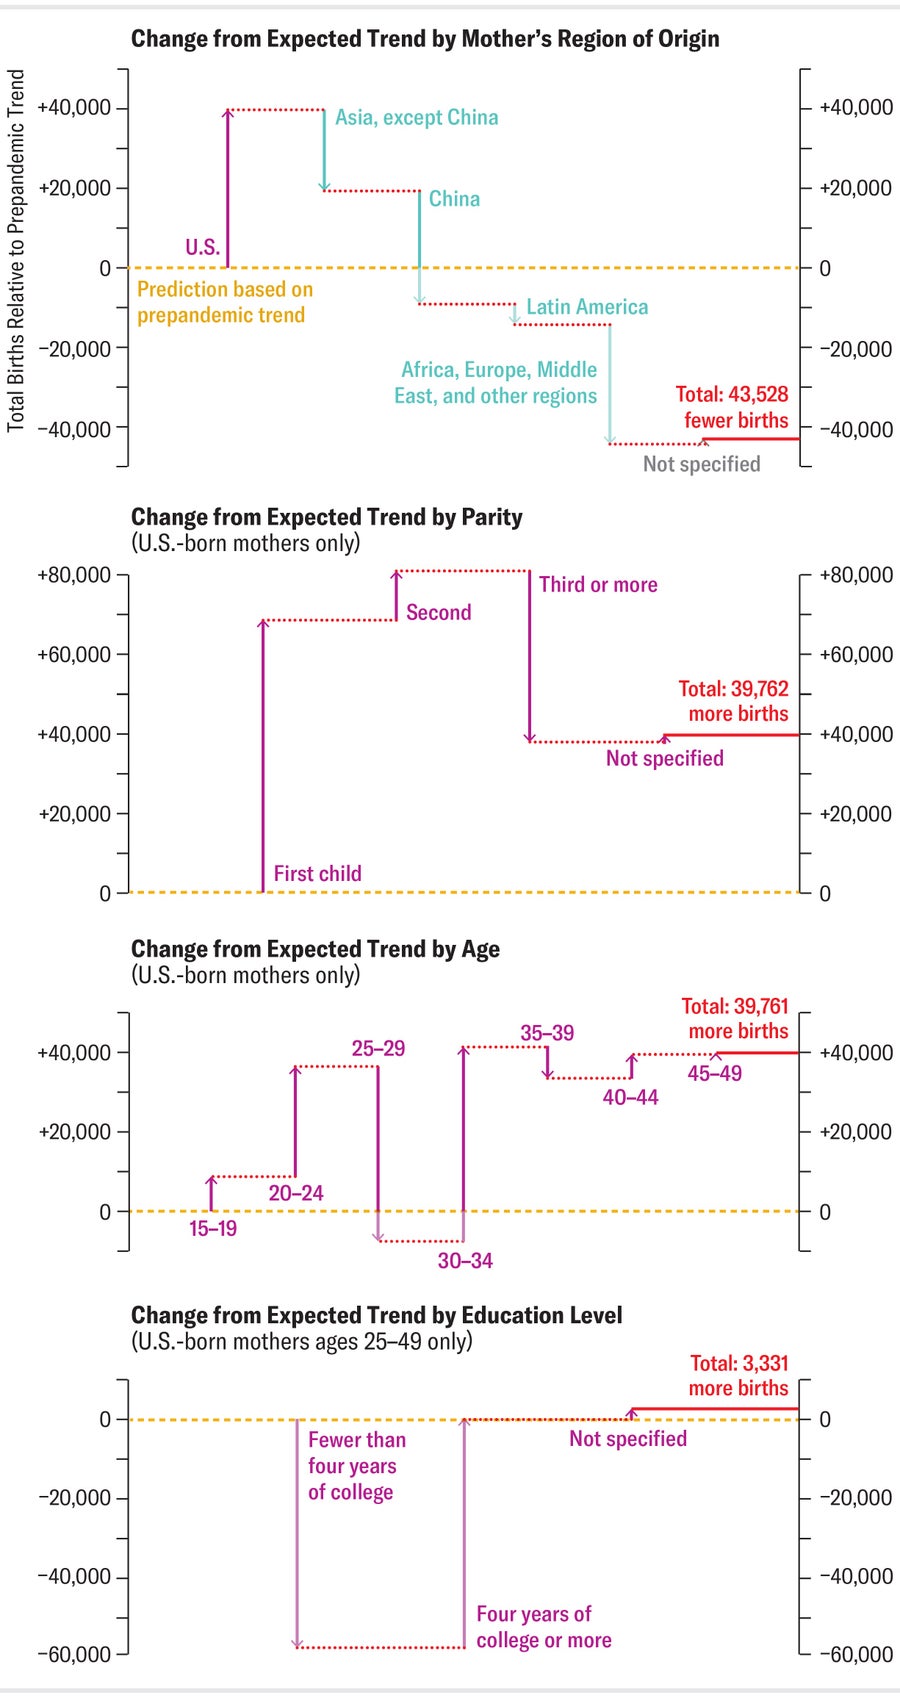
In 2021 the birth rate bounced back even more than predicted. This reversal is attributable mainly to an increase in births to mothers born in the U.S. (except among Black women). The biggest increases in births occurred among women younger than 25 and those having their first child. Among women older than 25, the largest upticks in births were for those aged 30 to 34 and those with a college education. Because there is a lag in data on births, these results do not include the most recent trends. But data from California suggest births were still increasing as of early 2023.
On supporting science journalism
If you're enjoying this article, consider supporting our award-winning journalism by subscribing. By purchasing a subscription you are helping to ensure the future of impactful stories about the discoveries and ideas shaping our world today.
Study co-author Janet Currie, an economist at Princeton University, speculates that working from home (for those who were able to) gave people more flexibility to start a family. In other words, Currie says, “if you made it easier for people to have children, maybe more of them would.”
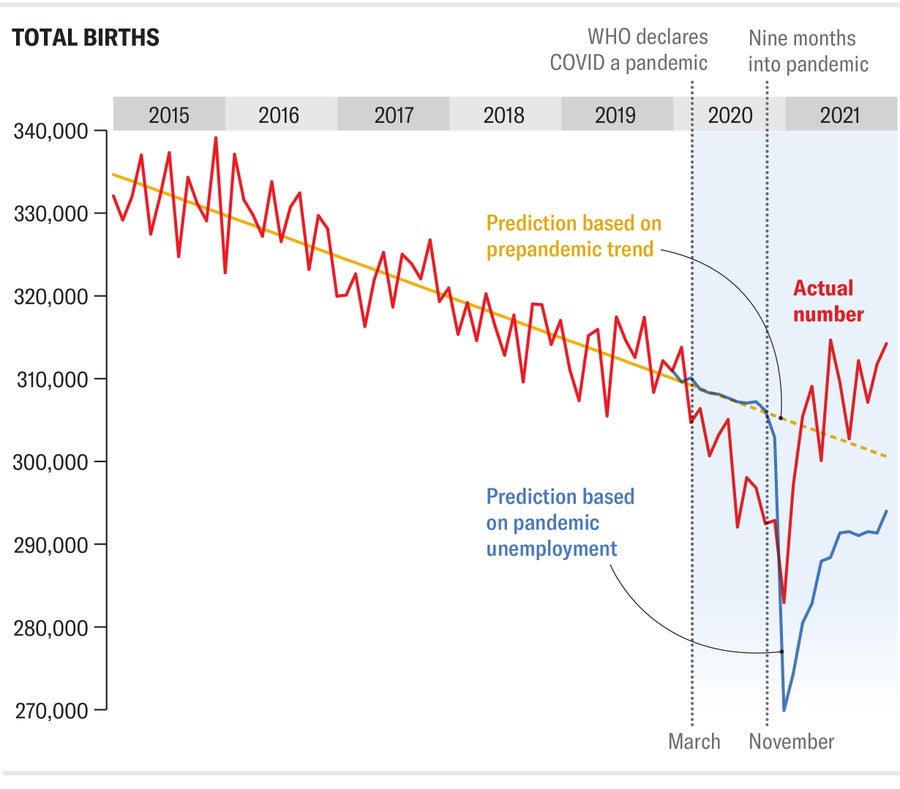
Number of U.S. Births
The number of babies born from one month to the next is variable but tends to follow a fairly predictable pattern. Researchers suspected that COVID’s economic impacts would alter this pattern, but surprisingly, the 2020 dip in births was not proportional to the rise in unemployment. And in 2021, the numbers rebounded sharply, making the net loss in births less severe than expected.
Credit: Amanda Montañez; Source: “The COVID-19 Baby Bump in the United States, by Martha J. Bailey Janet Currie and Hannes Schwandt, in PNAS, Vol. 120; August 15, 2023
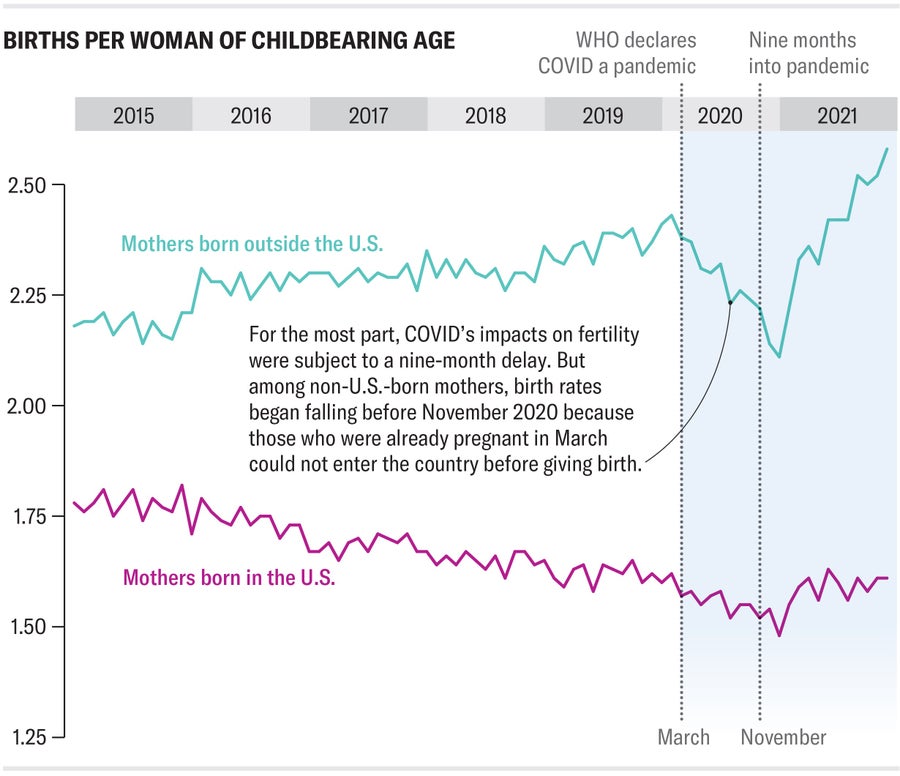
U.S. Total Fertility Rates
Total fertility rate measures the expected number of children a woman will have in her lifetime based on current trends. In 2020 U.S. fertility fell to a record low, but the decline was largely driven by pandemic border restrictions, which kept those in other countries from giving birth in the U.S. Among U.S.-born mothers, fertility experienced a net increase from the start of 2020 to the end of 2021.
Credit: Amanda Montañez; Source: “The COVID-19 Baby Bump in the United States, by Martha J. Bailey Janet Currie and Hannes Schwandt, in PNAS, Vol. 120; August 15, 2023
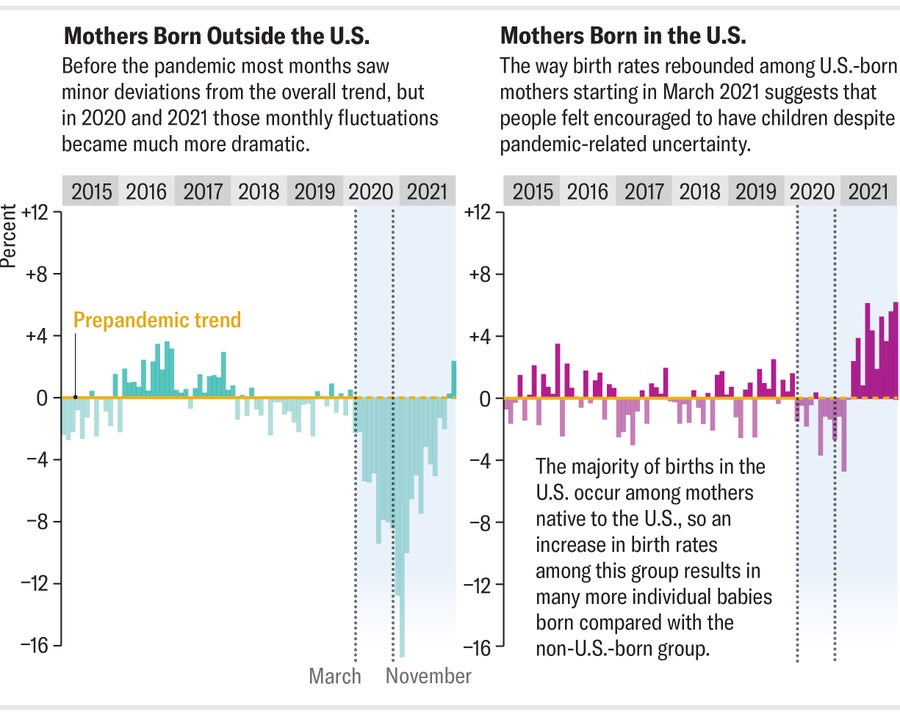
Changes from Expected Trends
To measure COVID’s effects on birth rates, it is useful to compare data from each month with what researchers think those numbers would have looked like had prepandemic trends continued. Since about 2007, U.S. fertility has been falling steadily. The pandemic initially seemed to amplify this trend, but among U.S.-born mothers, 2021 saw a “baby bump” of 5.1 percent above pre-COVID estimates.
Credit: Amanda Montañez; Source: “The COVID-19 Baby Bump in the United States, by Martha J. Bailey Janet Currie and Hannes Schwandt, in PNAS, Vol. 120; August 15, 2023
How Changes Varied among Specific Groups
These charts show how birth rates shifted in different ways for different demographic groups. Each of the specified subgroups pushed the numbers up or down to arrive at a net gain or loss in total births over the 2020–2021 period, compared with pre-COVID predictions.
Credit: Amanda Montañez; Source: “The COVID-19 Baby Bump in the United States, by Martha J. Bailey Janet Currie and Hannes Schwandt, in PNAS, Vol. 120; August 15, 2023
